Introduction to Environment and Environmental Studies


Definition:

"Environ" means "surrounding" and "ment" means "action". The meaning of the word "Environment" is the surrounding of an organism.

It denotes the total sum of physical, chemical and biological factors that directly influence the survival, growth, development and reproduction of living organism.

Environment has two parts;
  1. Biotic Part:
            It is made of all living organisms which includes, plant, animals, birds, micro- organisms etc.
  1. Abiotic Part:
            Also Called physical environment. It is the non-living components of environment which includes, light, water, temperature, humanity, soil, air etc.

Types Of Environments:


Environmental Science:

It can be defined as the scientific study of the earth, air, water, living organisms and the man with his impact on environment.

Environmental Engineering:

It can be defined as the application of engineering principles, to the protection and enhancement of quality of environment, public health and public welfare.

For Example, the environmental engineer plans, designs, constructs and operate sewage treatment plant, water treatment plant, air pollution control equipments etc.

Environmental Studies:

It can be defined as branch of study concerned with the environmental disturbances and the minimisation of their impacts through changes in the society (social sciences).

Importance of Environmental Studies:

(Environmental protection starts by creating awareness)

  • It is very important for every person for self-fulfilment and social development.
  • It helps to understand different food chains and ecological balance in nature.
  • It helps to understand and appreciate how the environment is used for making a living and for promoting a material culture.
  • It helps in appreciating and enjoying nature and society.
  • It generates concern for the changing environment in a systematic manner for the future as well as immediate welfare of mankind.
  • It directs attention towards population explosion, exhaustion of natural resources and pollution of environment and throws light on solutions.

Goals of Environmental education:

“To develop a world population that is aware of and concerned about environment as a whole and the problems associated with it, and committed to work individually as well as collectively towards solutions of current problems and prevention of future problems”

Primary objectives: (SPEAK Awareness)
  • Skill: Acquire skills for identifying and solving environmental problems.
  • Participation: To provide an opportunity to be actively involved at all levels in working towards the solution of environmental problems.
  • Evaluation ability: Develop the ability to evaluate environmental measures and education programmes in terms of ecological, economic, social and aesthetic factors.
  • Attitude: Acquire a set of values and feelings of concern; motivation for active participation to improve and protect environment.
  • Knowledge: Gain a variety of experiences and acquire a basic understanding of the environment and its associated problems.
  • Awareness: Acquire an awareness of the environment as a whole and its allied problems and sensitivity.

Components of Environment:

Atmosphere :

The thick, gaseous cover of air surrounding the earth is called atmosphere. It sustains life on earth by removing harmful cosmic and ultraviolet rays through absorption, maintaining heat balance, providing oxygen for respiration and carbon dioxide for photosynthesis.

It is the gaseous envelope surrounding the earth and extends upto 500 kms above the earth’s surface. The composition of the atmosphere is given in Table.


The Structure of the Atmosphere:

The atmosphere is broadly divided into four major zones viz. Troposphere, Stratosphere, Mesosphere and Thermosphere. Characteristics of these zones are pictorially represented below in Fig.


Troposphere:
Troposphere is the layer of air nearest to the ground. Temperature decreases with height. The average temperature drops from 15ºC at sea level to –56.5ºC at 11 km above sea level.

It contains 70% of the atmospere's mass. The density of the troposhers decreases with altitude. The air near the ground level is heated by the radiation from earth, but the temperature decreases uniformily with atlitude. this decrease of temperature with altitude is known as lapse rate.

Tropopause is the top of the troposphere, which is a transition layer between Troposphere and Stratosphere.

Stratosphere:
Stratosphere is the layer of air above the troposphere where temperature increases with height. The average temperature rises to –2.5ºC at 50 km above sea level. Ozone is found in higher concentrations between 20 and 30 km above the surface. Hence sometimes this layer is referred to as the “ozone layer”. Ozone absorbs radiant energy from the sun and hence warmer temperatures are encountered in the stratosphere.
Stratopause is the top of the stratosphere, which is a transition layer between Stratosphere and Mesosphere.

Mesosphere:
Mesosphere is the layer of air above the stratosphere where temperature decreases with height. The average temperature decreases to –90°C at 90 km. This is the coldest layer of the atmosphere. Mesopause is the top of the mesosphere, which is a transition layer between Mesosphere and Thermosphere.

Thermosphere:
Thermosphere is the layer of air above the mesosphere. The temperatures in the thermosphere increase with increasing height, but there are not many molecules in this layer. The air becomes less and less dense as we reach space.

Hydrospere:
This comprises all water resources both surface and ground water. The world’s water is found in oceans and seas, lakes and reservoirs, rivers and streams, glaciers and snowcaps in the Polar Regions in addition to ground water below the land areas. The distribution of water among these resources is as under Table.

The water locked up in the Oceans and Seas are too salty and cannot be used directly for human consumption, domestic, agriculture or Industrial purposes. Only less than 1% of water resources are available for human exploitation.

Lithosphere:
The upper layer of the earth's crust is called lithospere. It is made up of soil, minarals, rocks and other organic as well as inorganic matter. The lithosphere covers the crust of the earth and is extended up to 100 km. 


Biosphere:
It is that portion of the earth's surface, hydrosphere and atmosphere where life exists. Biosphere is a biological environment where living organisms interact with physical environment, e.g. soil, water and air.


Factors affecting Choice & Selection of Irrigation Methods

Following are some reasons and factors which affect the selection of an irrigation system for a specific area:

Compatibility of the irrigation system:


The irrigation system for a field or a farm must be compatible with the other existing farm operations, such as land preparation, cultivation, and harvest.
  • Level of Mechanization
  • Size of Fields
  • Cultivation
  • Pest Control
The use of the large mechanized equipment requires longer and wider fields. The irrigation systems must not interfere with these operations and may need to be portable or function primarily outside the crop boundaries (i.e. surface irrigation systems).
Smaller equipment or animal-powered cultivating equipment is more suitable for small fields and more permanent irrigation facilities.

Topographical characteristics of area:


Topography is a major factor affecting irrigation, particularly surface irrigation. Of general concern are the location and elevation of the water supply relative to the field boundaries, the area and configuration of the fields, and access by roads, utility lines (gas, electricity, water, etc.), and migrating herds whether wild or domestic.

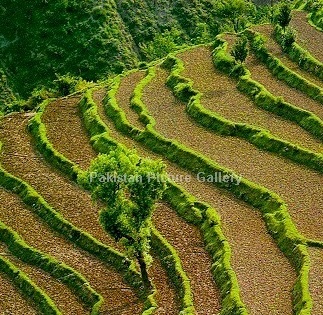
.Terraced Fields IrrigationPlain fields Irrigation

Field slope and its uniformity are two of the most important topographical factors. Surface systems, for instance, require uniform grades in the 0-5 percent range.

Restrictions on irrigation system selection due to topography include:
  • Groundwater levels
  • the location and relative elevation of the water source
  • field boundaries
  • acreage in each field
  • the location of roads
  • power and water lines and other obstructions
  • the shape and slope of the field

Economics and cost of the irrigation method:


The type of irrigation system selected is an important economic decision.
Some types of pressurized systems have high capital and operating costs but may utilize minimal labour and conserve water. Their use tends toward high value cropping patterns.
Other systems are relatively less expensive to construct and operate but have high labour requirements.
Some systems are limited by the type of soil or the topography found on a field.
The costs of maintenance and expected life of the rehabilitation along with an array of annual costs like energy, water, depreciation, land preparation, maintenance, labour and taxes should be included in the selection of an irrigation system.

Main costs include:
  • Energy
  • Water
  • Land Preparation
  • Maintenance
  • Labor
  • taxes

Soils:


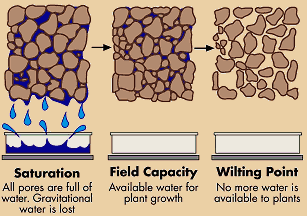
The soil's moisture-holding capacity, intake rate and depth are the principal criteria affecting the type of system selected.
Sandy soils typically have high intake rates and low soil moisture storage capacities and may require an entirely different irrigation strategy than the deep clay soil with low infiltration rates but high moisture-storage capacities.
Sandy soil requires more frequent, smaller applications of water whereas clay soils can be irrigated less frequently and to a larger depth. Other important soil properties influence the type of irrigation system to use.

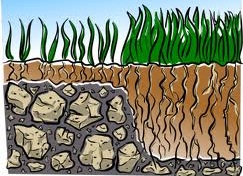
Soil Moisture CapacitySoil Depth Factor in Irrigation Method Selection

The physical, biological and chemical interactions of soil and water influence the hydraulic characteristics and filth. The mix of silt in a soil influences crusting and erodibility and should be considered in each design. The soil influences crusting and erodibility and should be considered in each design.
The distribution of soils may vary widely over a field and may be an important limitation on some methods of applying irrigation water.

The soil type usually defines:
  • Soil moisture-holding capacity
  • The intake rate
  • Effective soil depth

Water supply:


The quality and quantity of the source of water can have a significant impact on the irrigation practices. Crop water demands are continuous during the growing season. The soil moisture reservoir transforms this continuous demand into a periodic one which the irrigation system can service. A water supply with a relatively small discharge is best utilized in an irrigation system which incorporates frequent applications. The depths applied per irrigation would tend to be smaller under these systems than under systems having a large discharge which is available less frequently. The quality of water affects decisions similarly. Salinity is generally the most significant problem but other elements like boron or selenium can be important. A poor quality water supply must be utilized more frequently and in larger amounts than one of good quality.


Crops to be irrigated:


The yields of many crops may be as much affected by how water is applied as the quantity delivered. Irrigation systems create different environmental conditions such as humidity, temperature, and soil aeration. They affect the plant differently by wetting different parts of the plant thereby introducing various undesirable consequences like leaf burn, fruit spotting and deformation, crown rot, etc. Rice, on the other hand, thrives under ponded conditions.

Definition of Cash Crops:

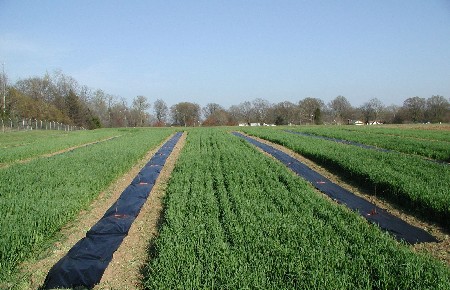
Some crops have high economic value and allow the application of more capital-intensive practices, these are called "cash crops" or Cash crop farming. Deep-rooted crops are more amenable to low-frequency, high-application rate systems than shallow-rooted crops. Examples of cash crops are Rice, Wheat, Seed Oils, Tobacco, cotton, sugar cane, etc.

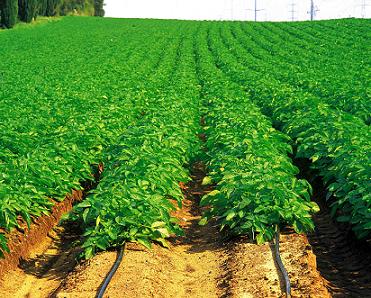
Crops Covered Wheat Cash Crop irrigationTea Cash Crop irrigation
Cash Crop Water Requirement

Crop characteristics that influence the choice of irrigation system are:
  • The tolerance of the crop during germination, development and maturation to soil salinity, aeration, and various substances, such as boron
  • The magnitude and temporal distribution of water needs for maximum production
  • The economic value of the crop

Social influences on the selection of irrigation method:


Beyond the confines of the individual field, irrigation is a community enterprise. Individuals, groups of individuals, and often the state must join together to construct, operate and maintain the irrigation system as a whole. Within a typical irrigation system there are three levels of community organization.

There is the individual or small informal group of individuals participating in the system at the field and tertiary level of conveyance and distribution. There are the farmer collectives which form in structures as simple as informal organizations or as complex as irrigation districts. These assume, in addition to operation and maintenance, responsibility for allocation and conflict resolution. And then there is the state organization responsible for the water distribution and use at the project level.

Irrigation system designers should be aware that perhaps the most important goal of the irrigation community at all levels is the assurance of equity among its members. Thus the operation, if not always the structure, of the irrigation system will tend to mirror the community view of sharing and allocation.

Irrigation often means a technological intervention in the agricultural system even if irrigation has been practiced locally for generations. New technologies mean new operation and maintenance practices. If the community is not sufficiently adaptable to change, some irrigation systems will not succeed.

External influences:


Conditions outside the sphere of agriculture affect and even dictate the type of system selected. For example, national policies regarding foreign exchange, strengthening specific sectors of the local economy, or sufficiency in particular industries may lead to specific irrigation systems being utilized. Key components in the manufacture or importation of system elements may not be available or cannot be efficiently serviced. Since many irrigation projects are financed by outside donors and lenders, specific system configurations may be precluded because of international policies and attitudes.

(Courtesy: http://www.aboutcivil.org/)

Causes of failure of Weirs & their Remedies

Common causes of failure of weirs include:

  • Excessive and progressive downstream erosion, both from within the stream and through lateral erosion of the banks.
  • Erosion of inadequately protected abutments.
  • Hydraulic removal of fines and other support material from downstream protection (gabions and aprons) resulting in erosion of the apron protection.
  • Deterioration of the cutoff and subsequent loss of containment.
  • Additional aspects specific to concrete, rockfill or steel structures.

PIPING:

  • Piping is caused by groundwater seeping out of the bank face. Grains are detached and entrained by the seepage flow and may be transported away from the bank face by surface runoff generated by the seepage, if there is sufficient volume of flow.
  • The exit gradient of water seeping under the base of the weir at the downstream end may exceed a certain critical value of soil. As a result the surface soil starts boiling and is washed away by percolating water. The progressive erosion backwash at the upstream results in the formation of channel (pipe) underneath the floor of weir.
  • Since there is always a differential head between upstream & downstream, water is constantly moving form upstream to downstream from under the base of weir. However, if the hydraulic gradient becomes big, greater than the critical value, then at the point of existance of water at the downstream end, it begins to dislodge the soil particles and carry them away.
  • In due course, when this erosion continues, a sort of pipe or channel is formed within the floor through which more particles are transported downstream which can bring about failure of weir.
  • Piping is especially likely in high banks backed by the valley side, a terrace, or some other high ground. In these locations the high head of water can cause large seepage pressures to occur. Evidence includes: Pronounced seep lines, especially along sand layers or lenses in the bank; pipe shaped cavities in the bank; notches in the bank associated with seepage zones and layers; run-out deposits of eroded material on the lower bank.


Remedies:

  • Decrease Hydraulic gradient i.e. increase path of percolation by providing sufficient length of impervious floor.
  • Providing curtains or piles at both upstream and downstream.

RUPTURE OF FLOOR DUE TO UPLIFT:

If the weight of the floor is insufficient to resist the uplift pressure, the floor may burst. This bursting of the floor reduces the effective length of the impervious floor, which will resulting increasing exit gradient, and can cause failure of the weir.

Remedies:

  • Providing impervious floor of sufficient length of appropriate thickness.
  • Pile at upstream to reduce uplift pressure downstream.

RUPTURE OF FLOOR DUE TO SUCTION CAUSED BY STANDING WAVES:

Hydraulic jump formed at the downstream of water.

Remedies:

  • Additional thickness
  • Floor thickness in one concrete mass

SCOUR ON THE UPSTREAM AND DOWNSTREAM OF THE WEIR:

Scouring in Weirs Occurs due to contraction of natural water way.

Remedies:
  • Piles at greater depth than scour level

(Courtesy : http://www.aboutcivil.org)


Seminar Topics

  1. Feasibility Of Drip Irrigation
  2. Methods Of Ground Water Recharge & It’s Effect On Quality Of Ground Water
  3. Technological Potential For Improvements Of Water Harvesting
  4. Coastal   Protection Structures
  5. Relevance Of Remote Sensing And GIS In Civil Engineering
  6. Surge Tanks
  7. Sewage Water As The Source Of Irrigation And Plant Nutrients
  8. Study Of Coastal Villages Affected By  Salinity Ingress In Amreli District
  9. Socio Economic Analysis Of The Kalpsar Project
  10. Soil Erosion And It’s Controlling Techniques
  11. Land Reclamation For Agricultural Purpose
  12. A Case Study On: Social And Environmental Impacts Of Sardar Sarovar Dam Project
  13. Advanced Technologies In Sewer Maintenance
  14. Review And Analysis Of Drought Monitoring And Management In India
  15. Digital Elevation Model
  16. Seminar On Subsurface Dams
  17. Impact Of Climate Change On Groundwater Resources
  18. Reclamation Of Waterlogged And Saline Soils For Agricultural Purpose
  19. Recycling Of Waste Water
  20. Importance of Liners For Canals
  21. Qyality Analysis Of Ground Water
  22. Qualitative Anlysis Of Irrigation Water
  23. Roof Rainwater Harvesting – A Case Study
  24. Groundwater Potential And Problems : A Case Study
  25. Rain Water Harvesting And Ground Water Conservation
  26. Interlinking Of Indian Rivers -Challenges And Prospects OR Interlinking Of Indian Rivers intrusion Detection System
  27. Surface Water Pre-treatment Using Floating Media Filter
  28. GIS – For Rain Water Recharge To Enhance The Ground Water
  29. Ground Water Conservation By Artificial Recharge Techniques
  30. Impact Of Urbanization On Groundwater Resources
  31. Application Of Remote Sensing & G.I.S. In Groundwater Prospecting
  32. Water Evaporation And Weeds Control By Mulching In Drip Irrigation System
  33. Sediment And Water Quality Analysis
  34. Remote Sensing , GIS And Its Applications
  35. Water Resources Development in Developing Countries
  36. Piano Key Spillways for Dams
  37. Proposed site for Bandhara In order to Raise Ground Water level.
  38. Fusegate System for Ungated Irrigation Scheme

Model Evaluation Methods

Root Mean Square Error (RMSE)
The Root Mean Square Error (RMSE) (also called the root mean square deviation, RMSD) is a frequently used measure of the difference between values predicted by a model and the values actually observed from the environment that is being modelled. These individual differences are also called residuals, and the RMSE serves to aggregate them into a single measure of predictive power.

The RMSE of a model prediction with respect to the estimated variable Xmodel is defined as the square root of the mean squared error:

where Xobs is observed values and Xmodel is modelled values at time/place i.

The RMSE values can be used to distinguish model performance in a calibration period with that of a validation period as well as to compare the individual model performance to that of other predictive models.

Normalized Root Mean Square Error (NRMSE)
Non-dimensional forms of the RMSE are useful because often one wants to compare RMSE with different units. There are two approaches: normalize the RMSE to the range of the observed data, or normalize to the mean of the observed data.
(the latter one is also called CV,RMSE for the resemblance with calculating the coefficient of variance).


Pearson Correlation Coefficient (r)
Correlation – often measured as a correlation coefficient – indicates the strength and direction of a linear relationship between two variables (for example model output and observed values). A number of different coefficients are used for different situations. The best known is the Pearson product-moment correlation coefficient (also called Pearson correlation coefficient or the sample correlation coefficient), which is obtained by dividing the covariance of the two variables by the product of their standard deviations. If we have a series n observations and n model values, then the Pearson product-moment correlation coefficient can be used to estimate the correlation between model and observations.
The correlation is +1 in the case of a perfect increasing linear relationship, and -1 in case of a decreasing linear relationship, and the values in between indicates the degree of linear relationship between for example model and observations. A correlation coefficient of 0 means the there is no linear relationship between the variables.

The square of the Pearson correlation coefficient (r2), known as the coefficient of determination, describes how much of the variance between the two variables is described by the linear fit.

Nash-Sutcliffe Coefficient (E)
The Nash-Sutcliffe model efficiency coefficient (E) is commonly used to assess the predictive power of hydrological discharge models. However, it can also be used to quantitatively describe the accuracy of model outputs for other things than discharge (such as nutrient loadings, temperature, concentrations etc.). It is defined as:

where Xobs is observed values and Xmodel is modelled values at time/place i.

Nash-Sutcliffe efficiencies can range from -¥ to 1. An efficiency of 1 (E = 1) corresponds to a perfect match between model and observations. An efficiency of 0 indicates that the model predictions are as accurate as the mean of the observed data, whereas an efficiency less than zero (-¥ < E < 0) occurs when the observed mean is a better predictor than the model.

Essentially, the closer the model efficiency is to 1, the more accurate the model is.

Time Series Patterns

In this article (I found this article from https://www.otexts.org), we will discuss to three types of time series patterns.

Trend

A trend exists when there is a long-term increase or decrease in the data. It does not have to be linear. Sometimes we will refer to a trend “changing direction” when it might go from an increasing trend to a decreasing trend.

Seasonal

A seasonal pattern exists when a series is influenced by seasonal factors (e.g., the quarter of the year, the month, or day of the week). Seasonality is always of a fixed and known period.

Cyclic

A cyclic pattern exists when data exhibit rises and falls that are not of fixed period. The duration of these fluctuations is usually of at least 2 years.

Many people confuse cyclic behaviour with seasonal behaviour, but they are really quite different. If the fluctuations are not of fixed period then they are cyclic; if the period is unchanging and associated with some aspect of the calendar, then the pattern is seasonal. In general, the average length of cycles is longer than the length of a seasonal pattern, and the magnitude of cycles tends to be more variable than the magnitude of seasonal patterns.
The following four examples shows different combinations of the above components.
Figure: Four time series exhibiting different types of time series patterns.


The monthly housing sales (top left) show strong seasonality within each year, as well as some strong cyclic  behaviour  with period about 6–10 years. There is no apparent trend in the data over this period.


The US treasury bill contracts (top right) show results from the Chicago market for 100 consecutive trading days in 1981. Here there is no seasonality, but an obvious downward trend. Possibly, if we had a much longer series, we would see that this downward trend is actually part of a long cycle, but when viewed over only 100 days it appears to be a trend.

The Australian monthly electricity production (bottom left) shows a strong increasing trend, with strong seasonality. There is no evidence of any cyclic  behaviour here.

The daily change in the Dow Jones index (bottom right) has no trend, seasonality or cyclic  behaviour. There are random fluctuations which do not appear to be very predictable, and no strong patterns that would help with developing a forecasting model.

Spillway

Introduction:


Spillways are structures constructed to provide safe release of flood waters from a dam to a downstream are, normally the river on which the dam has been constructed.

Every reservoir has a certain capacity to store water. If the reservoir is full and flood waters enter the same, the reservoir level will go up and may eventually result in overtopping of the dam. To avoid this situation, the flood has to be passed to the downstream and this is done by providing a spillway which draws water from the top of the reservoir. A spillway can be a part of the dam or separate from it.

Spillways can be controlled or uncontrolled. A controlled spillway is provided with gates which can be raised or lowered. Controlled spillways have certain advantages as will be clear from the discussion that follows. When a reservoir is full, its water level will be the same as the crest level of the spillway.

Parameters considered in Designing Spillways:


Many parameters need consideration in designing a spillway. These include:
  • The inflow design flood hydro-graph
  • The type of spillway to be provided and its capacity
  • The hydraulic and structural design of various components and
  • The energy dissipation downstream of the spillway


The topography, hydrology, hydraulics, geology and economic considerations all have a bearing on these decisions. For a given inflow flood hydro graph, the maximum rise in the reservoir level depends on the discharge characteristics of the spillway crest and its size and can be obtained by flood routing. Trial with different sizes can then help in getting the optimum combination.

Classification of Spillways:


Spillways are ordinarily classified according to their most prominent feature, either as it pertains to the control, to the discharge channel, or to some other component. The common types of spillway in use are the following:

Free Overfall (Straight Drop) Spillway:


In this type of spillway, the water freely drops down from the crest, as for an arch dam (Figure 1). It can also be provided for a decked over flow dam with a vertical or adverse inclined downstream face (Figure 2). Flows may be free discharging, as will be the case with a sharp-crested weir or they may be supported along a narrow section of the crest. Occasionally, the crest is extended in the form of an overhanging lip (Figure 3) to direct small discharges away from the face of the overfall section. In free falling water is ventilated sufficiently to prevent a pulsating, fluctuating jet.


Ogee Spillway:


The Ogee spillway is generally provided in rigid dams and forms a part of the main dam itself if sufficient length is available. The overflow type spillway has a crest shaped in the form of an ogee or S-shape. The upper curve of the ogee is made to conform closely to the profile of the lower nappe of a ventilated sheet of water falling from a sharp crested weir (Figure 6). Flow over the crest of an overflow spillway is made to adhere to the face of the profile by preventing access of air to the underside of the sheet of flowing water.

Naturally, the shape of the overflow spillway is designed according to the shape of the lower nappe of a free flowing weir conveying the discharge flood. Hence, any discharge higher than the design flood passing through the overflow spillway would try to shoot forward and get detached from the spillway surface, which reduces the efficiency of the spillway due to the presence of negative pressure between the sheet of water and spillway surface.

An ogee crest apron may comprise an entire spillway such as the overflow of a concrete gravity dam (Figure 7), or the ogee crest may only be the control structure for some other type of spillway (Figure 8).


Chute Spillway:


A chute spillway, variously called as open channel or trough spillway, is one whose discharge is conveyed from the reservoir to the downstream river level through an open channel, placed either along a dam abutment or through a saddle. The control structure for the chute spillway need not necessarily be an overflow crest, and may be of the side-channel type as has been shown in Figure 10.


Generally, the chute spillway has been mostly used in conjunction with embankment dams, like the Tehri dam, for example. Chute spillways are simple to design and construct and have been constructed successfully on all types of foundation materials, ranging from solid rock to soft clay.

Side Channel Spillway:


A side channel spillway is one in which the control weir is placed approximately parallel to the upper portion of the discharge channel, as may be seen from Figure 10. When seen in plan with reference to the dam, the reservoir and the discharge channel, the side channel spillway would look typically as in Figure 11 and its sectional view in Figure 12. The flow over the crest falls into a narrow trough opposite to the weir, turns an approximate right angle, and then continues into the main discharge channel.


Shaft Spillway:


A Shaft Spillway is one where water enters over a horizontally positioned lip, drops through a vertical or sloping shaft, and then flows to the downstream river channel through a horizontal or nearly horizontal conduit or tunnel (Figure 13). The structure may be considered as being made up of three elements, namely, an overflow control weir, a vertical transition, and a closed discharge channel. When the inlet is funnel shaped, the structure is called a Morning Glory Spillway. The name is derived from the flower by the same name, which it closely resembles especially when fitted with anti-vortex piers (Figure 14). These piers or guide vanes are often necessary to minimize vortex action in the reservoir, if air is admitted to the shaft or bend it may cause troubles of explosive violence in the discharge tunnel-unless it is amply designed for free flow.


Tunnel Spillway:


Where a closed channel is used to convey the discharge around a dam through the adjoining hill sides, the spillway is often called a tunnel or conduit spillway. The closed channel may take the form of a vertical or inclined shaft, a horizontal tunnel through earth or rock, or a conduit constructed in open cut and backfilled with earth materials. Most forms of control structures, including overflow crests, vertical or inclined orifice entrances, drop inlet entrances, and side channel crests, can be used with tunnel spillways. Two such examples have been shown in Figs. 15 and 16. When the closed channel is carried under a dam, as in Figure 13, it is known as a conduit spillway.


Tunnel spillways are advantageous for dam sites in narrow gorges with steep abutments or at sites where there is danger to open channels from rock slides from the hills adjoining the reservoir.

Siphon Spillway:


A siphon spillway is a closed conduit system formed in the shape of an inverted U, positioned so that the inside of the bend of the upper passageway is at normal reservoir storage level (Figure 17). This type of siphon is also called a Saddle siphon spillway. The initial discharges of the spillway, as the reservoir level rises above normal, are similar to flow over a weir. Siphonic action takes place after the air in the bend over the crest has been exhausted. Continuous flow is maintained by the suction effect due to the gravity pull of the water in the lower leg of the siphon.


Another type of siphon spillway (Figure 18) designed by Ganesh Iyer has been named after him. It consists of a vertical pipe or shaft which opens out in the form of a funnel at the top and at the bottom it is connected by a right angle bend to a horizontal outlet conduit. The top or lip of the funnel is kept at the Full Reservoir Level. On the surface of the funnel are attached curved vanes or projections called the volutes.


References:


Enhanced by Zemanta